Using the Detail view
The Detail view shows rate trends over time. It's the right place when you want to see how a competitor has moved over the past few weeks, or compare price curves across your comp set side by side.
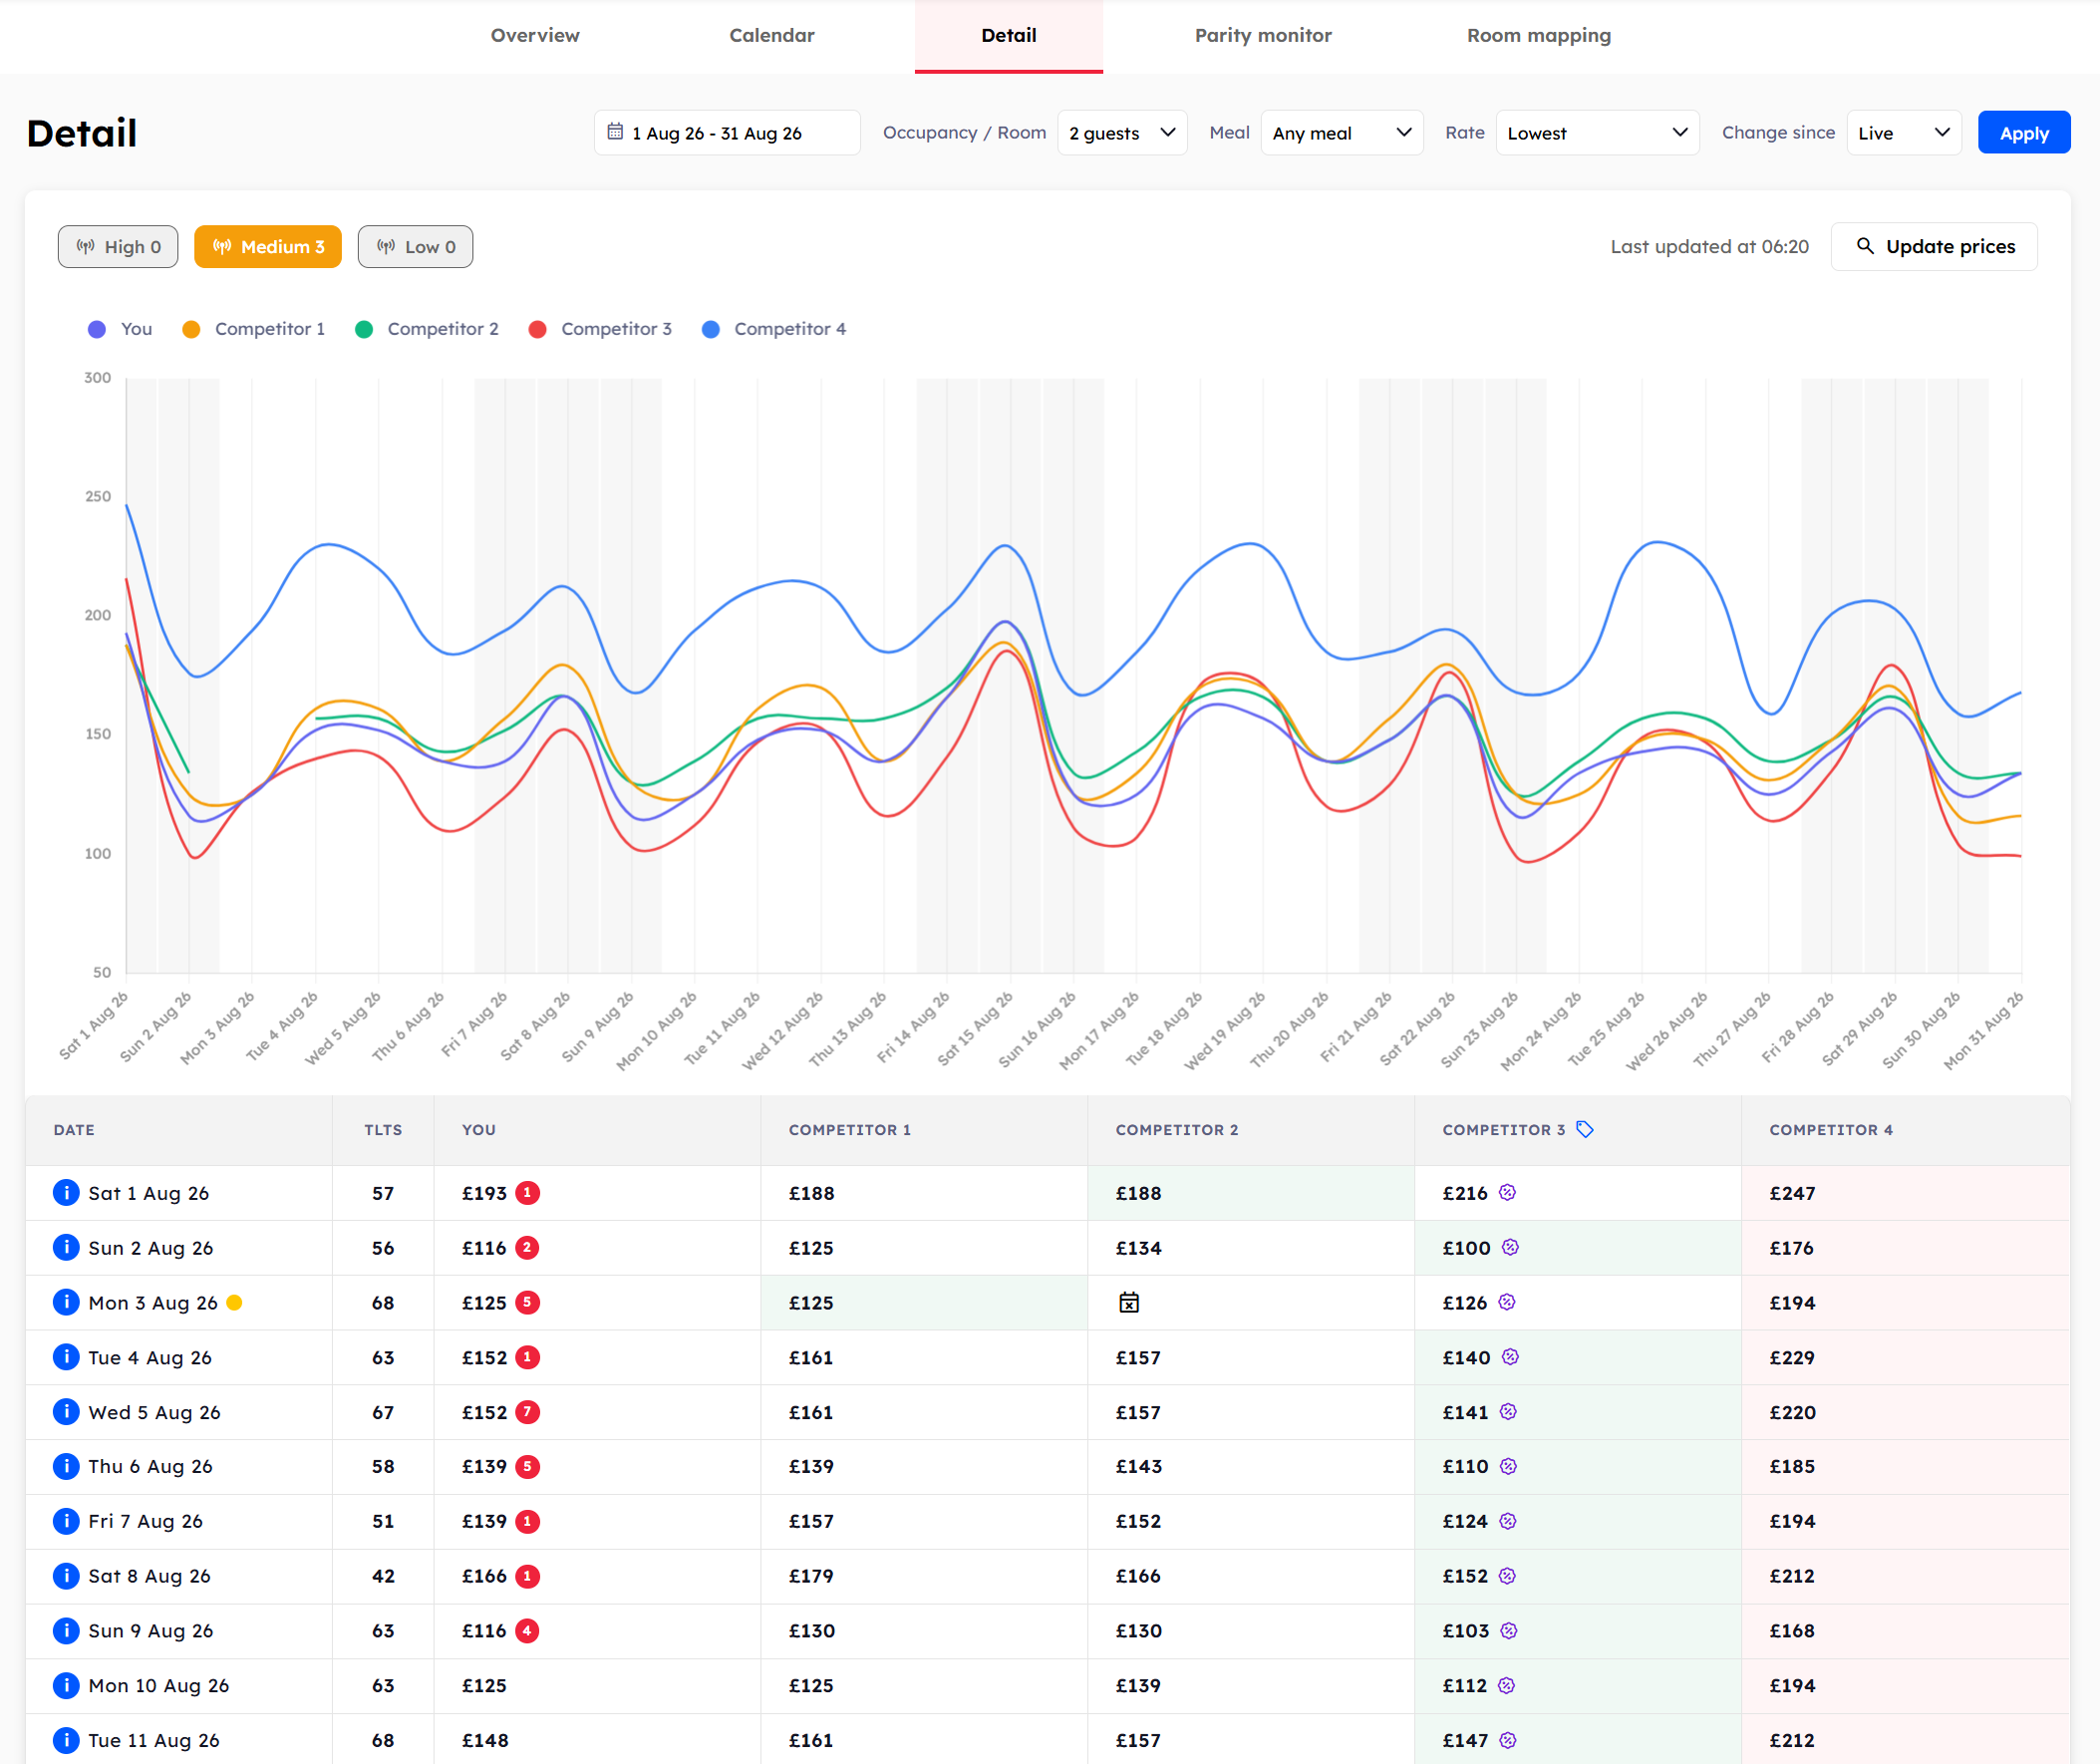
The trend chart
The chart at the top of the page plots one line per property in your comp set, with date along the x-axis and rate along the y-axis. Hover any point to see the exact price for that date and property.
Use the chart to look for patterns:
A competitor whose curve consistently sits above or below yours.
Dates where the comp set tightens together (an event or holiday).
Step changes that suggest a competitor has revised their rate strategy.
The price table
Below the chart sits a row-per-date table. Columns include:
DATE — the stay date.
Total LTS — your remaining inventory (only visible if Mews is connected).
One column per property in your comp set.
Each price cell shows the rate, the room type, and any rate condition icons (Genius discount, breakfast included). The cell shading helps you see which property is cheapest and most expensive across the row at a glance.
Filtering
The Detail view respects the same filters as the Overview and Calendar: guest count, meal plan, and rate type. Open Edit filters at the top of the page to adjust them. Changing filters refreshes both the chart and the table.
Actions
Use Update prices to refresh data (up to three manual updates per day) and Export to download the current table. The Last update X minutes ago timestamp shows when the data was last refreshed.